Today I wanted to address the question of how to test the business model. In ESAF, I suggest that there are 3 key steps to understanding whether a business model is sound:
- Create a unit economic model of the business to understand the key revenue and cost drivers
- Conduct break-even analysis on the unit level to see if the company can generate margins on each unit. If this isn't the case, expand the model to take into account multiple units and see what scale is required for the company to reach break-even.
- Conduct Crystal Ball analysis to understand expected profit values based on a Monte Carlo simulation and de-risk the business model
First, creating a unit economic model is crucial because it strips the business down to its core revenue/cost drivers and eliminates the unnecessary complexity that most models have. This model is created by identifying an economic unit for the business (whether it is a cookie, a box of cookies, a delivery truck of cookies or the daily supply an average supermarket purchases) and allocating all revenues and costs (both variable and allocated overhead) to that unit.
Once we have this unit economic model, we simply ask the objective question of whether the business model is viable given the existing market size. If the unit has a positive margin in the model, immediately we know that the business model is validated. If the unit runs a loss, the model can be enhanced to account for multiple units to see if the company can break even as it scales up (and economies of scale lower overhead cost down across all economic 'units'). Once break-even volume is determined, this can then be compared to market size to judge whether or the business is viable. For example, if you found that it would take 9 billion customers to sign up for an annual subscription to your web service, you have objectively proven that the business is not viable since there are some 6 billion people in the entire world. When we conduct our break-even analysis , all we test is business viability. This does not take into account whether the business can actually achieve the market share necessary to break even (we examine this question later). It is an objective analysis that can be understood by everyone around the table.
If the business seems viable from a unit economic model perspective, the next thing to test is whether it can actually meet the ROI targets necessary to make the business worthwhile to the entrepreneur and investor. To do this, a Monte Carlo Simulation software such as Crystal Ball can be used. This software allows you to create a basic financial model and designate 'ranges' for inputs (ie: sales figures, resource costs, etc) instead of coming up with distinct best/worst/expected case scenarios. For example, if you think that salaries might be in the $40k-60k range with an average of $48k, it will allow you to input these ranges into the system. Once this is complete the software will iteratively simulate thousands of possible scenarios across all model inputs and generate two key outputs. The first output is a chart outlining results from the simulation with expected outcomes. Lets take this chart as an example:
 This chart shows that across several thousand simulations performed on the input model , the business can indeed suffer a loss, although the expected value is a net income of $6K a year with an optimistic scenario of ~$12K. This data can be extremely useful when trying to compute ROI targets and value a company.
The second key output is a tornado chart that illustrates the key sensitivities of the business model. While running random simulations, the software isolates the most sensitive drivers of profitability and presents them in the form below:
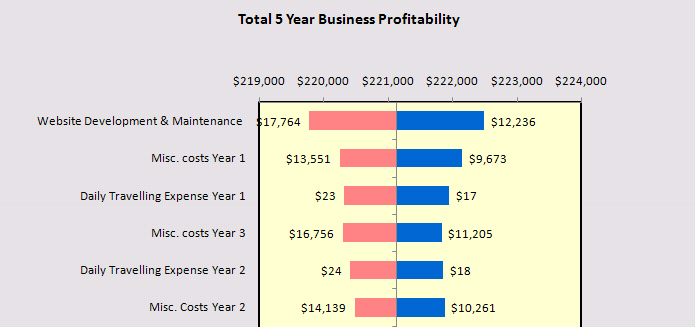 This tornado chart shows the most sensitive variable in the model is Website Development costs (which will in the best case be ~$12K and in the worst case ~$18K.) Using this insight, entrepreneurs and investors can understand the key risks in the business and take steps to mitigate the key drivers of risk.
My experience has shown me that 'objective' analysis is crucial in the initial stages of discussing business models with early stage companies, as it ensures buy-in from both entrepreneurs and investors. Otherwise, there is simply too much room for subjectivity when looking at assumptions one by one and debating whether they are reasonable.